
How dangerous are American roads? Over the past several decades, the United States has made progress in reducing roadway fatalities through initiatives such as requiring seat belts and airbags in vehicles, enforcing laws against impaired driving, and improving road infrastructure and traffic regulations.
Despite these improvements, the U.S. has gained a concerning reputation for having a higher rate of motor vehicle deaths per capita than any other developed country. The risks extend beyond vehicle occupants; American roadways also pose a significant threat to pedestrians. From 2013 to 2022, traffic-related death rates in the U.S. rose by 50% for pedestrians and 22.5% overall, despite a steep decline in rates in many other high-income countries.
Tragically, U.S. pedestrian death rates were highest overall among people aged 15 to 24 and 25 to 64 across all countries examined by the CDC. The situation worsened post-COVID-19 pandemic, with 43,230 lives lost in motor vehicle crashes in 2021, including 7,388 pedestrians. Incidents of distracted and impaired driving have been increasing, and with the United States maintaining a blood alcohol concentration (BAC) limit that is higher than in most other countries, the dangers persist.
Since awareness is the first step toward protection and progress, the experienced accident attorneys of Camili & Capo, PA have analyzed the most recent U.S. highway car crash data to identify the most dangerous roads in America.
Copy and paste the HTML code below to share our infographic on your website.
<center>
<textarea readonly>
<a href="https://www.camililaw.com/new-data-shows-the-most-dangerous-roads-in-america/">
<img src="https://cdn.sanity.io/images/bbnawgvb/production/1a81cef1cc4c966a874365a43afffa1a517222fa-1500x3360.png" alt="The Most Dangerous Roads in America - Camili Law New Jersey Highway Accident Lawyers - Infographic" title="The Most Dangerous Roads in America - CamiliLaw.com - Infographic"></a><br><a href="https://www.CamiliLaw.com" alt="Camili Law New Jersey Highway Accident Lawyers" title="CamiliLaw.com">By CamiliLaw.com</a>
</textarea>
</center>
What Is the Most Dangerous Road in America?
Interstate 4 (I-4)
The most dangerous highway in the United States is I-4, with 1.54 fatal crashes per mile between 2019 and 2023. Spanning 132 miles, this interstate stretches across Florida from Daytona Beach to Tampa, connecting major cities such as Orlando and Lakeland along the way.
Why is I-4 so dangerous? Often described as the deadliest highway in America, I-4 experiences near-constant heavy traffic, leading to stop-and-go congestion and hazardous bottlenecks. Florida attracts millions of tourists each year, many of whom are unfamiliar with the area, often creating an unpredictable, confusing driving environment that increases the likelihood of car accidents.
Speeding is another significant factor contributing to traffic fatalities on I-4. A quick search for “I-4 speeding” reveals how prevalent and reckless these incidents are, with numerous reports of drivers arrested for exceeding speeds of 100 miles per hour. Additionally, certain segments of I-4 are known for their sharp turns, narrow lanes, and challenging merging situations, further compounding the dangers posed by heavy traffic and excessive speeding.
To make matters worse, Florida has a high rate of unlicensed and uninsured drivers, with the latter accounting for 20.6%. Crash statistics reveal that around 17% to 19% of fatal accidents involve drivers with invalid licenses.
If you plan to drive on an unfamiliar highway, a proactive step towards road safety is to research the route beforehand. Investigate the areas most prone to crashes and congestion and try to travel during off-peak hours if possible.
Which U.S. Highway Has the Most Traffic Fatalities Overall?
Interstate 10 (I-10)
Between 2019 and 2023, I-10 had the highest number of fatal car accidents in the United States, with 1,952 deaths. Although I-4 had the most highway fatalities per mile, the high death toll on I-10 is mainly due to its extensive length. I-10 is the southernmost transcontinental highway stretching 2,460 miles from Santa Monica, California, to Jacksonville, Florida.
Certain areas are especially prone to interstate accidents. A three-mile section of I-10 in Louisiana, which includes a river bridge between Baton Rouge and Port Allen, is known as the “Devil’s Triangle” because of its frequent pileups and deadly crashes. Additionally, the Houston area on I-10 is among the worst for truck bottlenecks, creating hazardous conditions for all drivers.
Interstate 95 (1-95)
I-95 is the second-deadliest highway in the United States, averaging just under one fatal accident per mile. It had the highest highway risk score in 2025. If you check the infographic’s list of the most dangerous highways by state, you'll see that I-95 passes through eight states. This highway connects the entire East Coast from Houlton, Maine, to Miami, Florida, passing through many congested areas near major cities.
What is the most dangerous part of I-95? Known as “America’s Deadliest Mile,” this one-mile section of I-95 in Fort Lauderdale, Florida, between Marina Mile Boulevard and the I-595 interchange, has claimed 24 lives from 2000 to 2019. Constant congestion, complex off-ramps, and frequent construction increase dangers on this highway segment.
As New Jersey highway accident lawyers, we have witnessed firsthand the devastating effects of interstate accidents on I-95 and other major highways in the region. New Jersey is the most densely populated state in the country, with about 1,260 people per square mile. While it's unfortunate that higher population density leads to more traffic and, as a result, more accidents, many of these tragic incidents are entirely preventable.
At Camili & Capo, PA, we are dedicated to defending the rights of those affected by accidents and have established a track record of recovering millions for victims. We take interstate safety seriously and strive to deliver justice and compensation when preventable highway accidents disrupt lives.
The Deadliest Roads in the United States
Based on an analysis of fatal automobile accidents per mile on primary interstate highways from 2019 to 2023, segmented by state.
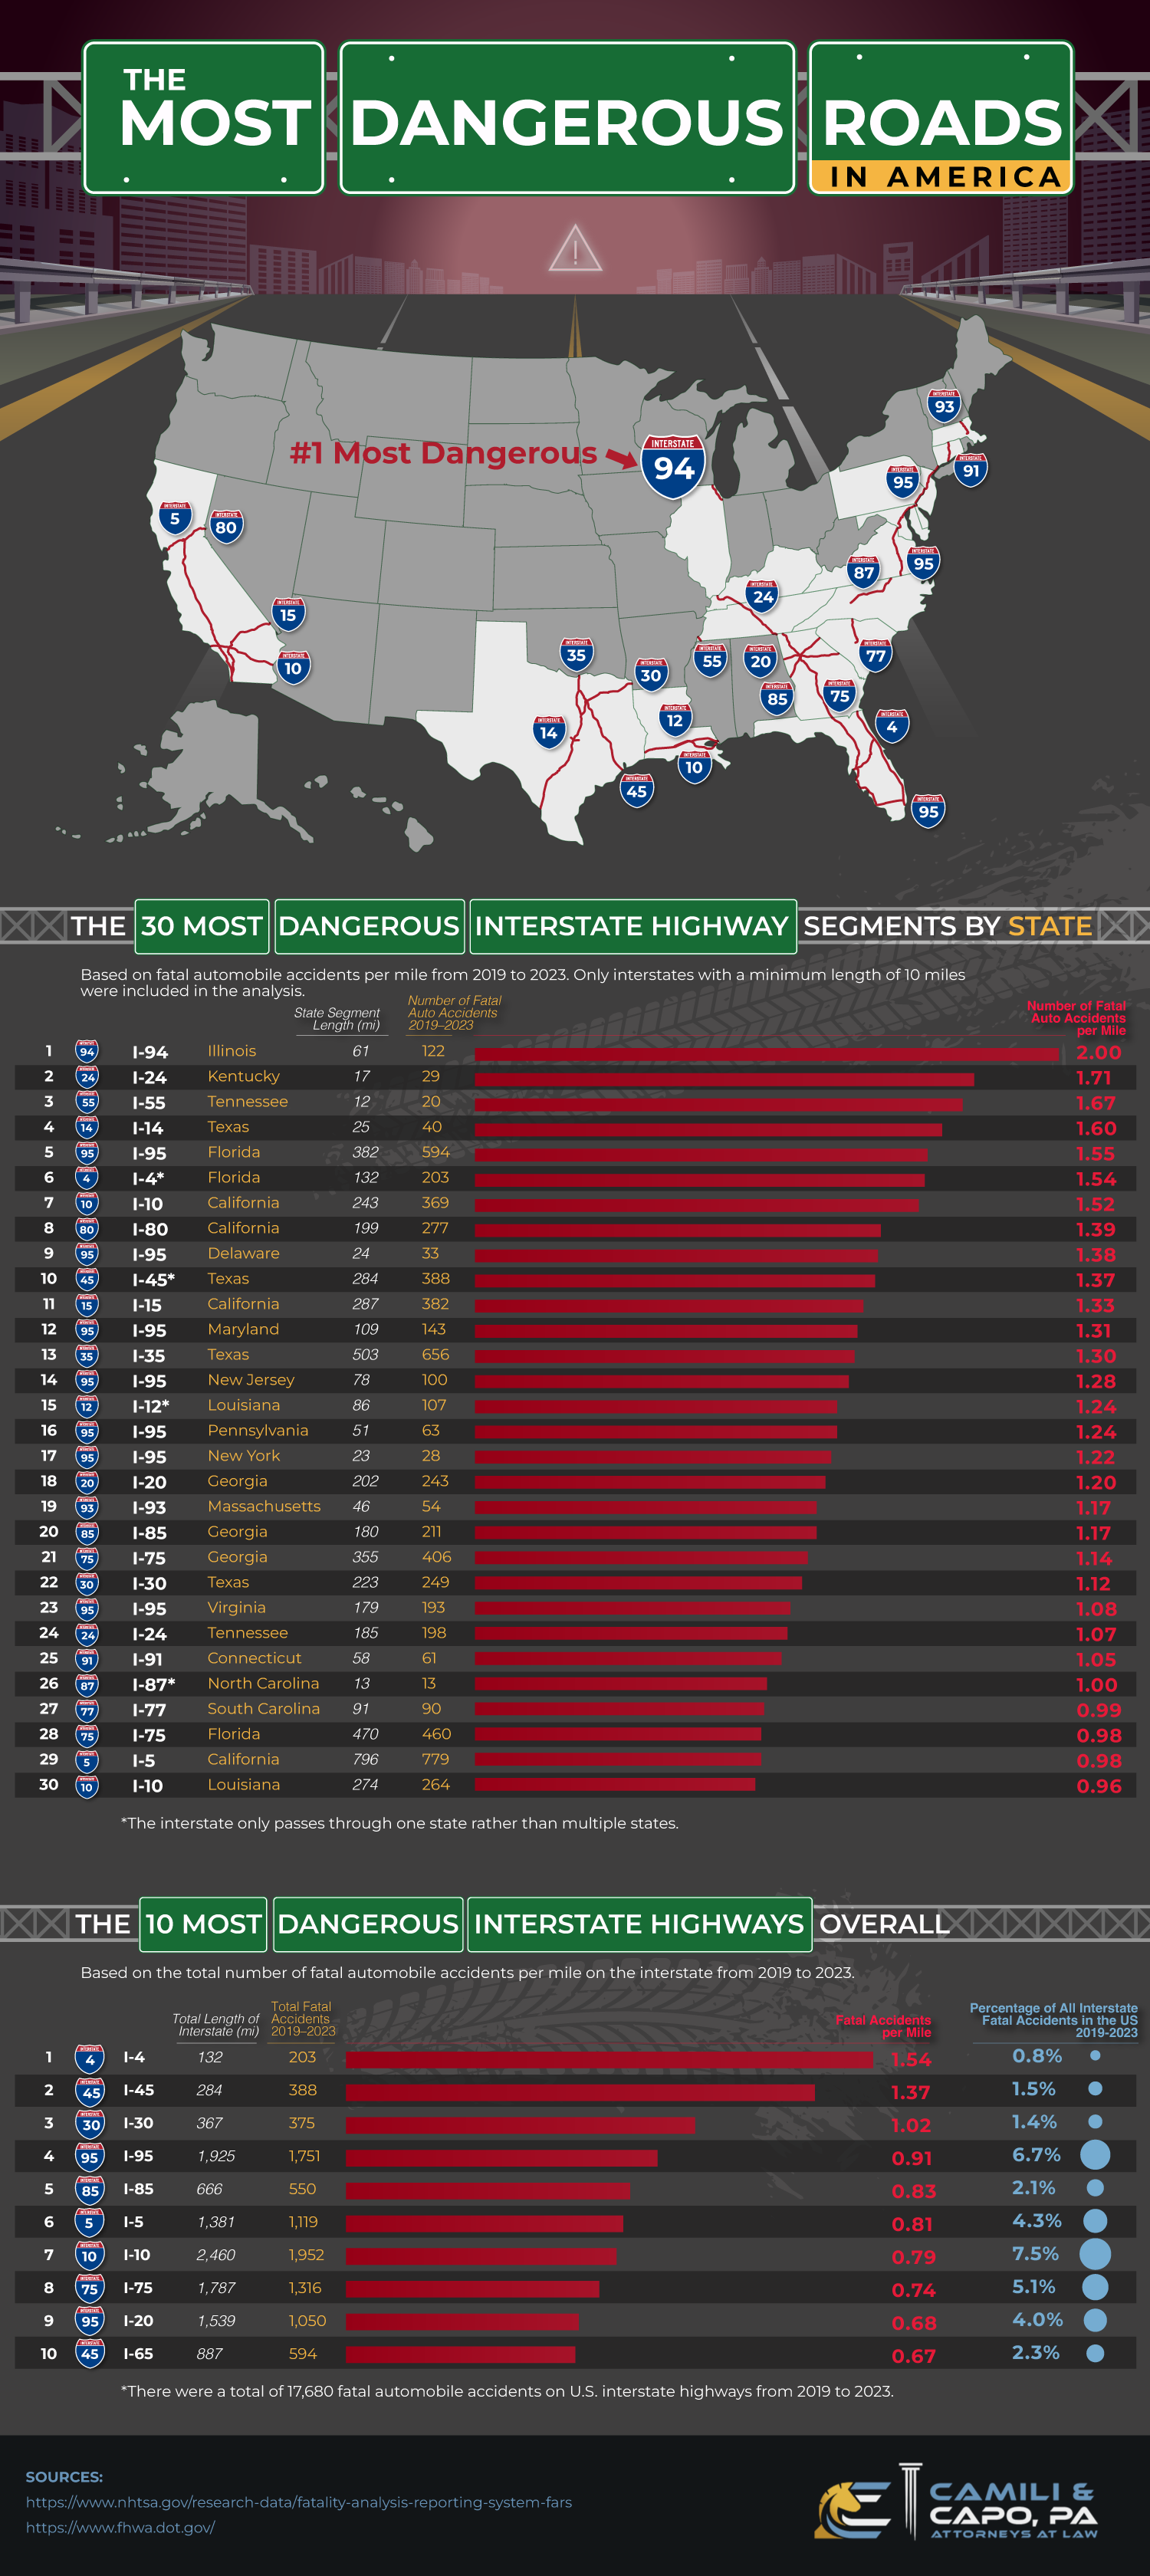
The 30 Most Dangerous Interstate Highway Segments by State
Based on fatal automobile accidents per mile from 2019 to 2023. Only interstates with a minimum length of 10 miles were included in the analysis.
| Rank | Interstate | State Segment | State Segment Length (mi) | Number of Fatal Auto Accidents 2019–2023 | Number of Fatal Auto Accidents per Mile |
|---|---|---|---|---|---|
| 1 | I-94 | Illinois | 61 | 122 | 2.00 |
| 2 | I-24 | Kentucky | 17 | 29 | 1.71 |
| 3 | I-55 | Tennessee | 12 | 20 | 1.67 |
| 4 | I-14 | Texas | 25 | 40 | 1.60 |
| 5 | I-95 | Florida | 382 | 594 | 1.55 |
| 6 | I-4* | Florida | 132 | 203 | 1.54 |
| 7 | I-10 | California | 243 | 369 | 1.52 |
| 8 | I-80 | California | 199 | 277 | 1.39 |
| 9 | I-95 | Delaware | 24 | 33 | 1.38 |
| 10 | I-45* | Texas | 284 | 388 | 1.37 |
| 11 | I-15 | California | 287 | 382 | 1.33 |
| 12 | I-95 | Maryland | 109 | 143 | 1.31 |
| 13 | I-35 | Texas | 503 | 656 | 1.30 |
| 14 | I-95 | New Jersey | 78 | 100 | 1.28 |
| 15 | I-12* | Louisiana | 86 | 107 | 1.24 |
| 16 | I-95 | Pennsylvania | 51 | 63 | 1.24 |
| 17 | I-95 | New York | 23 | 28 | 1.22 |
| 18 | I-20 | Georgia | 202 | 243 | 1.20 |
| 19 | I-93 | Massachusetts | 46 | 54 | 1.17 |
| 20 | I-85 | Georgia | 180 | 211 | 1.17 |
| 21 | I-75 | Georgia | 355 | 406 | 1.14 |
| 22 | I-30 | Texas | 223 | 249 | 1.12 |
| 23 | I-95 | Virginia | 179 | 193 | 1.08 |
| 24 | I-24 | Tennessee | 185 | 198 | 1.07 |
| 25 | I-91 | Connecticut | 58 | 61 | 1.05 |
| 26 | I-87* | North Carolina | 13 | 13 | 1.00 |
| 27 | I-77 | South Carolina | 91 | 90 | 0.99 |
| 28 | I-75 | Florida | 470 | 460 | 0.98 |
| 29 | I-5 | California | 796 | 779 | 0.98 |
| 30 | I-10 | Louisiana | 274 | 264 | 0.96 |
*The interstate only passes through one state rather than multiple states.
The 10 Most Dangerous Interstate Highways Overall
Based on the total number of fatal automobile accidents per mile on the interstate from 2019 to 2023.
| Rank | Interstate | Total Length of Interstate (mi) | Total Fatal Accidents 2019–2023 | Fatal Accidents per Mile | Percentage of All Interstate Fatal Accidents 2019–2023* |
|---|---|---|---|---|---|
| 1 | I-4 | 132 | 203 | 1.54 | 0.8% |
| 2 | I-45 | 284 | 388 | 1.37 | 1.5% |
| 3 | I-30 | 367 | 375 | 1.02 | 1.4% |
| 4 | I-95 | 1,925 | 1,751 | 0.91 | 6.7% |
| 5 | I-85 | 666 | 550 | 0.83 | 2.1% |
| 6 | I-5 | 1,381 | 1,119 | 0.81 | 4.3% |
| 7 | I-10 | 2,460 | 1,952 | 0.79 | 7.5% |
| 8 | I-75 | 1,787 | 1,316 | 0.74 | 5.1% |
| 9 | I-20 | 1,539 | 1,050 | 0.68 | 4.0% |
| 10 | I-65 | 887 | 594 | 0.67 | 2.3% |
| 11 | I-15 | California | 287 | 382 | 1.33 |
| 12 | I-95 | Maryland | 109 | 143 | 1.31 |
| 13 | I-35 | Texas | 503 | 656 | 1.30 |
| 14 | I-95 | New Jersey | 78 | 100 | 1.28 |
| 15 | I-12* | Louisiana | 86 | 107 | 1.24 |
| 16 | I-95 | Pennsylvania | 51 | 63 | 1.24 |
| 17 | I-95 | New York | 23 | 28 | 1.22 |
| 18 | I-20 | Georgia | 202 | 243 | 1.20 |
| 19 | I-93 | Massachusetts | 46 | 54 | 1.17 |
| 20 | I-85 | Georgia | 180 | 211 | 1.17 |
| 21 | I-75 | Georgia | 355 | 406 | 1.14 |
| 22 | I-30 | Texas | 223 | 249 | 1.12 |
| 23 | I-95 | Virginia | 179 | 193 | 1.08 |
| 24 | I-24 | Tennessee | 185 | 198 | 1.07 |
| 25 | I-91 | Connecticut | 58 | 61 | 1.05 |
| 26 | I-87* | North Carolina | 13 | 13 | 1.00 |
| 27 | I-77 | South Carolina | 91 | 90 | 0.99 |
| 28 | I-75 | Florida | 470 | 460 | 0.98 |
| 29 | I-5 | California | 796 | 779 | 0.98 |
| 30 | I-10 | Louisiana | 274 | 264 | 0.96 |
*There were a total of 17,680 fatal automobile accidents on U.S. interstate highways from 2019 to 2023.
Sources:
https://www.nhtsa.gov/research-data/fatality-analysis-reporting-system-fars