


Commercial trucks and delivery vans are part of everyday traffic across the U.S., carrying everything from heavy industrial freight to your latest online purchases. You see them every time you pull onto the highway or drive through local neighborhoods, and with that much activity, crashes are more likely. Traffic accidents are never ideal, but when they involve large tractor-trailers and delivery trucks, the consequences can be even more severe.
Unfortunately, while not all fleets are inherently more dangerous, some commercial fleets appear in federal crash records far more often than others. To better understand where these risks are most prevalent and which companies are involved, Camili & Capo are examining the commercial delivery fleets involved in the most crashes around the country.
Copy and paste the HTML code below to share our infographic on your website.
<a href="https://www.camililaw.com/research-studies/which-commercial-trucking-and-delivery-fleets-are-involved-in-the-most-crashes-in-each-state/">
<img src="https://cdn.sanity.io/images/bbnawgvb/production/745043f09a80f21643a8ad56d5acc73d484a19fa-1500x3826.png" alt="Which Commercial Trucking and Delivery Fleets Are Involved in the Most Crashes in Each State? – Camili & Capo, PA - Infographic" title="Which Commercial Trucking and Delivery Fleets Are Involved in the Most Crashes in Each State? - CamiliLaw.com - Infographic"></a><br><a href="https://www.camililaw.com" title="CamiliLaw.com">By CamiliLaw.com</a>How We Measured Commercial Fleet Crash Involvement
Commercial trucking and delivery vehicles range from massive tractor-trailers hauling freight across state lines to regional box trucks supplying local grocery stores to smaller delivery vans dropping packages directly at your front door. Because these vehicles are larger, heavier, and harder to maneuver than standard cars, collisions are more likely to cause severe injuries. Therefore, it’s important to differentiate these incidents from typical passenger car accidents.
To identify which fleets are most frequently involved in collisions, we reviewed data from the U.S. Department of Transportation’s Federal Motor Carrier Safety Administration (FMCSA) Safety Measurement System. The data covers crashes recorded from July 31, 2024, through July 29, 2026, and excludes passenger carriers, government fleets, and public transit systems to keep the focus on commercial freight and delivery services.
State rankings are based on the raw number of reported crashes for each carrier in that state, whereas national rankings adjust for each carrier’s most recently reported annual mileage to calculate annualized rates of crashes, injuries, and fatalities per 100 million miles traveled. Only fleets with at least 100 million recent annual miles and 50 or more crashes were included in the national rate comparison.
It’s important to note that these records reflect crash involvement, not fault. A carrier with more crashes does not necessarily mean its drivers caused those incidents.
What the Data Shows Across the U.S.
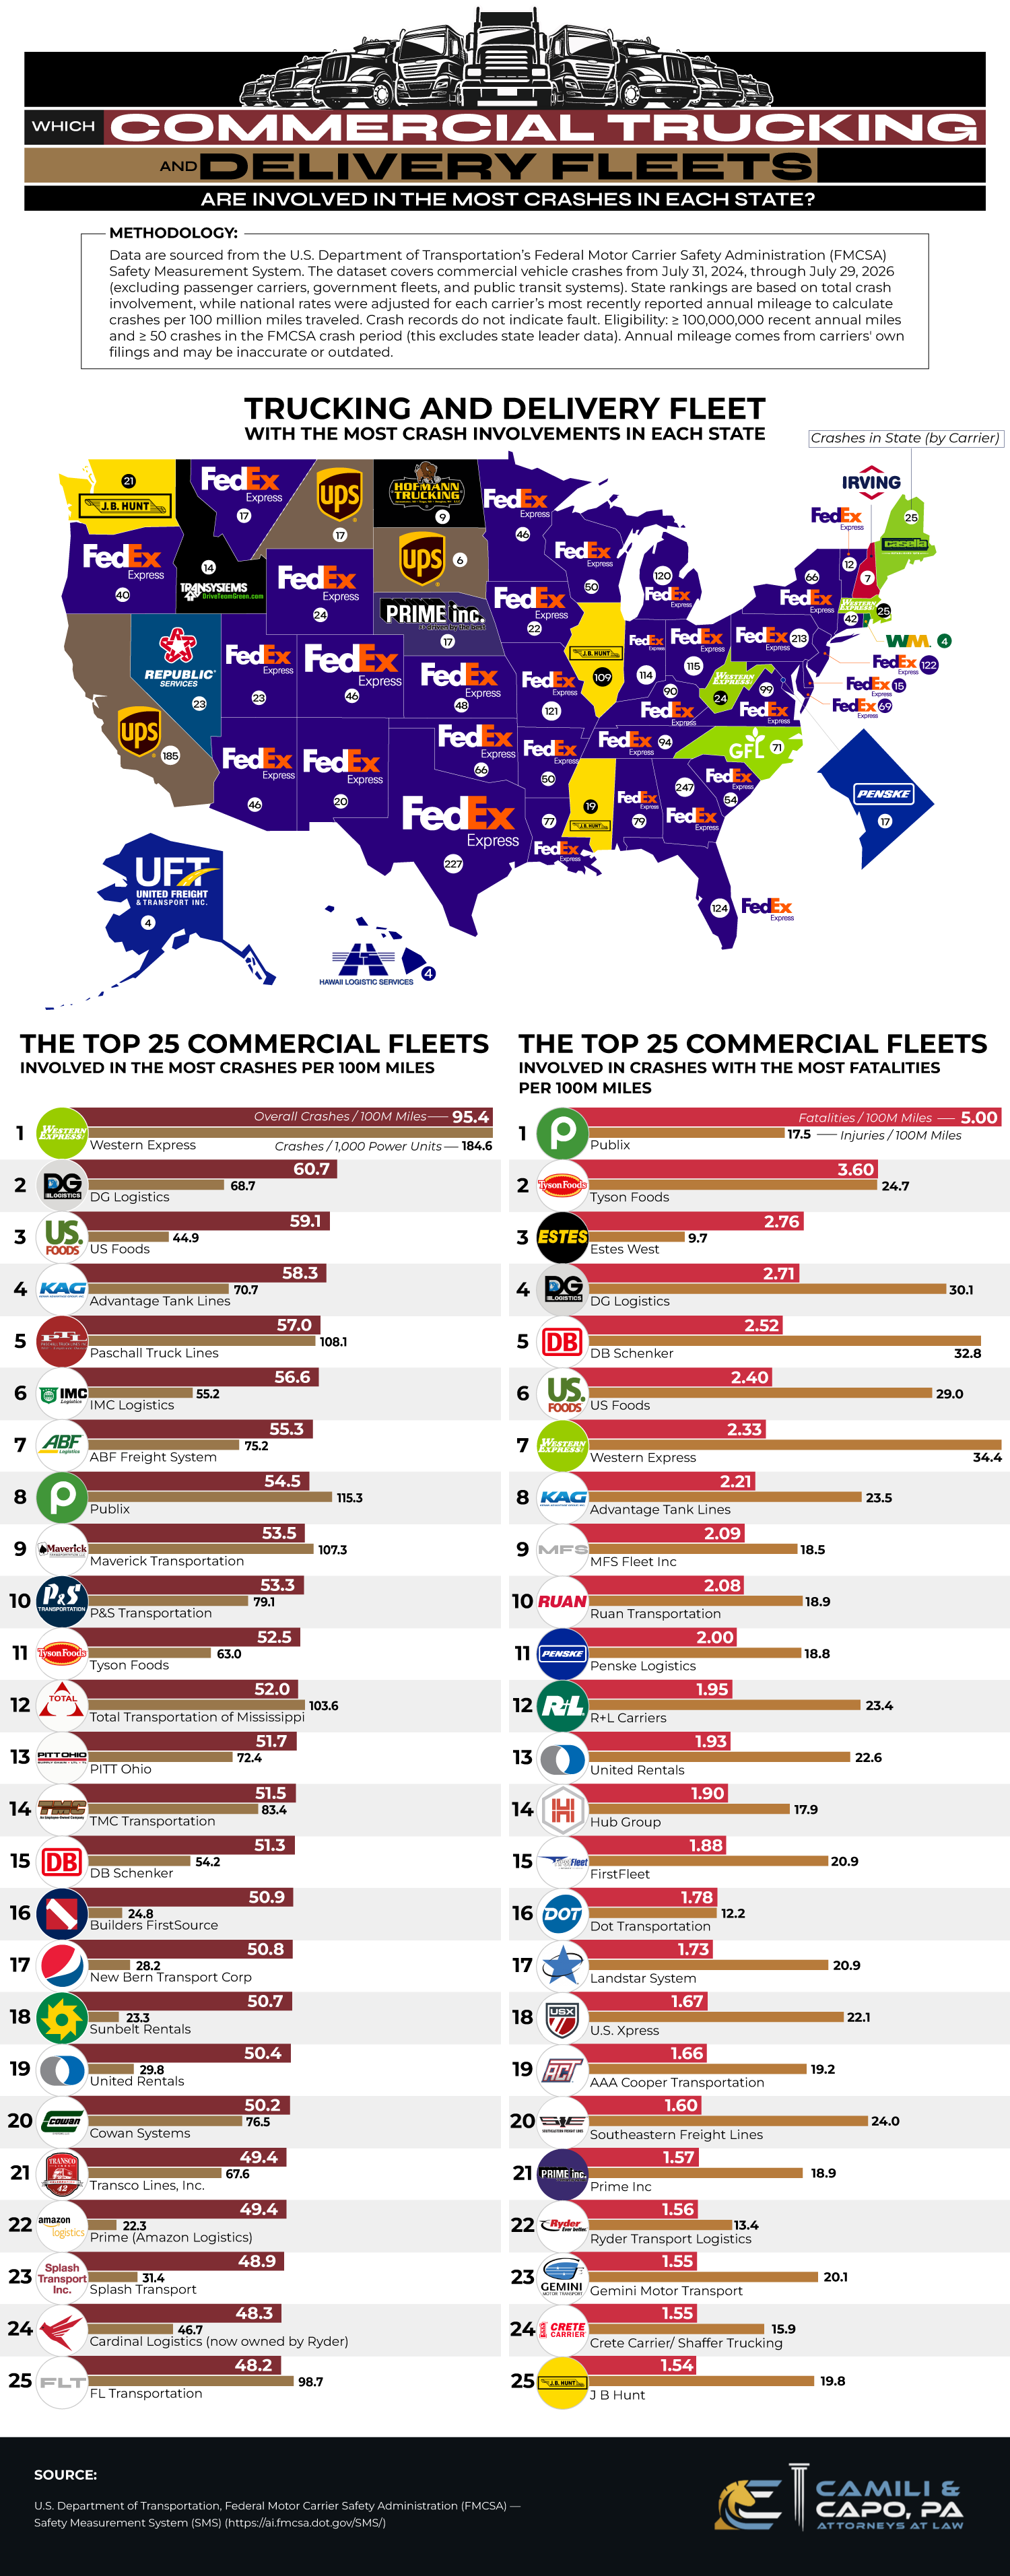
FedEx Express dominates the nationwide statistics as the fleet involved in the most crashes in 33 states. The states with the highest totals for FedEx Express crashes include Georgia, with 247 crashes; Texas, with 227; and Pennsylvania, with 213. In California, UPS ranks highest with 185 crashes, while J.B. Hunt had 109 crashes in Illinois.
These numbers likely reflect population size and highway density. States with larger populations tend to have more highway infrastructure and naturally generate higher demand for freight and delivery vehicles to keep store shelves stocked.
Furthermore, states that serve as primary entry points for global trade experience higher truck traffic. California, Texas, and Georgia are home to massive maritime shipping ports. Goods arriving from overseas are then transported around the country in commercial fleets, and the high volume of heavy truck traffic creates more opportunities for collisions.
Beyond total volume, Western Express has the highest crash-involvement rate among qualifying fleets at 95.4 crashes per 100 million miles. This is followed by DG Logistics at 60.7 and US Foods at 59.1. Interestingly, FedEx Express had more crashes nationally (3,101) overall, but because the company reported more than 4.3 billion annual miles, its adjusted rate was just 35.8 crashes per 100 million miles. Meanwhile, crashes involving Publix trucks had the highest fatality rate among qualifying fleets, at 5.00 per 100 million miles.
How New Jersey Compares
Here in New Jersey, FedEx Express was involved in 122 crashes over the two-year period analyzed, the highest total of any commercial trucking or delivery fleet in the state. Although New Jersey is the fourth smallest state by total area, only five states had a leading fleet with more crashes.
As the most densely populated state in the country, New Jersey also serves as a major gateway to several large markets. Our major highways are heavily traveled, transporting hundreds of millions of tons of cargo each year, while the Port of New York and New Jersey is one of the busiest in the country and the largest on the East Coast. As a result, despite its size, New Jersey's leading fleet has one of the highest crash counts in the country.
Protecting Your Rights After a Commercial Crash
Accidents involving commercial fleets remain a critical public safety concern for everyone on the road. The large size and weight of commercial trucks make occupants of smaller passenger vehicles particularly vulnerable to life-altering injuries, mounting medical bills, and lost wages.
The aftermath of a commercial truck crash can add another layer of burden, especially when multiple companies, insurers, and record types are involved. Sorting through medical bills, insurance paperwork, crash reports, and questions about who may be responsible can feel like an insurmountable task while you are recovering.
If you were injured in a commercial truck or delivery vehicle crash in New Jersey, Camili & Capo, PA can help you explore your options and navigate this complicated process. Contact us today to schedule a personal injury consultation and begin your journey to healing without the complications of the legal process.
The Commercial Trucking and Delivery Fleets Involved in the Most Crashes in Each State
Methodology
Data are sourced from the U.S. Department of Transportation’s Federal Motor Carrier Safety Administration (FMCSA) Safety Measurement System. The dataset covers commercial vehicle crashes from July 31, 2024, through July 29, 2026 (excluding passenger carriers, government fleets, and public transit systems). State rankings are based on total crash involvement, while national rates were adjusted for each carrier’s most recently reported annual mileage to calculate crashes per 100 million miles traveled. Eligibility: ≥ 100,000,000 recent annual miles and ≥ 50 crashes in the FMCSA crash period (this excludes state leader data). Annual mileage comes from carriers' own filings and may be inaccurate or outdated.
The Top 25 Commercial Fleets Involved in the Most Crashes per 100M Miles
Note: Only fleets with at least 100 million recent annual miles and 50 or more crashes are included. A power unit is a motorized vehicle, such as a tractor or straight truck.
| Rank | DBA | Overall Crashes / 100M Miles | Crashes / 1,000 Power Units |
|---|---|---|---|
| 1 | Western Express | 95.4 | 184.6 |
| 2 | DG Logistics | 60.7 | 68.7 |
| 3 | US Foods | 59.1 | 44.9 |
| 4 | Advantage Tank Lines | 58.3 | 70.7 |
| 5 | Paschall Truck Lines | 57.0 | 108.1 |
| 6 | IMC Logistics | 56.6 | 55.2 |
| 7 | ABF Freight System | 55.3 | 75.2 |
| 8 | Publix | 54.5 | 115.3 |
| 9 | Maverick Transportation | 53.5 | 107.3 |
| 10 | P&S Transportation | 53.3 | 79.1 |
| 11 | Tyson Foods | 52.5 | 63.0 |
| 12 | Total Transportation of Mississippi | 52.0 | 103.6 |
| 13 | PITT Ohio | 51.7 | 72.4 |
| 14 | TMC Transportation | 51.5 | 83.4 |
| 15 | DB Schenker | 51.3 | 54.2 |
| 16 | Builders FirstSource | 50.9 | 24.8 |
| 17 | New Bern Transport Corp | 50.8 | 28.2 |
| 18 | Sunbelt Rentals | 50.7 | 23.3 |
| 19 | United Rentals | 50.4 | 29.8 |
| 20 | Cowan Systems | 50.2 | 76.5 |
| 21 | Transco Lines, Inc. | 49.4 | 67.6 |
| 22 | Prime (Amazon Logistics) | 49.4 | 22.3 |
| 23 | Splash Transport | 48.9 | 31.4 |
| 24 | Cardinal Logistics (now owned by Ryder) | 48.3 | 46.7 |
| 25 | FL Transportation | 48.2 | 98.7 |
The Top 25 Commercial Fleets Involved in Crashes With the Most Fatalities per 100M Miles
| Rank | DBA | Fatalities / 100M Miles | Injuries / 100M Miles |
|---|---|---|---|
| 1 | Publix | 5.00 | 17.5 |
| 2 | Tyson Foods | 3.60 | 24.7 |
| 3 | Estes West | 2.76 | 9.7 |
| 4 | DG Logistics | 2.71 | 30.1 |
| 5 | DB Schenker | 2.52 | 32.8 |
| 6 | US Foods | 2.40 | 29.0 |
| 7 | Western Express | 2.33 | 34.4 |
| 8 | Advantage Tank Lines | 2.21 | 23.5 |
| 9 | MFS Fleet Inc | 2.09 | 18.5 |
| 10 | Ruan Transportation | 2.08 | 18.9 |
| 11 | Penske Logistics | 2.00 | 18.8 |
| 12 | R+L Carriers | 1.95 | 23.4 |
| 13 | United Rentals | 1.93 | 22.6 |
| 14 | Hub Group | 1.90 | 17.9 |
| 15 | FirstFleet | 1.88 | 20.9 |
| 16 | Dot Transportation | 1.78 | 12.2 |
| 17 | Landstar System | 1.73 | 20.9 |
| 18 | U.S. Xpress | 1.67 | 22.1 |
| 19 | AAA Cooper Transportation | 1.66 | 19.2 |
| 20 | Southeastern Freight Lines | 1.60 | 24.0 |
| 21 | Prime Inc | 1.57 | 18.9 |
| 22 | Ryder Transport Logistics | 1.56 | 13.4 |
| 23 | Gemini Motor Transport | 1.55 | 20.1 |
| 24 | Crete Carrier/Shaffer Trucking | 1.55 | 15.9 |
| 25 | J.B. Hunt | 1.54 | 19.8 |
Trucking and Delivery Fleet With the Most Crash Involvements in Each State
Montana’s top two fleets were tied at 17 crashes each.
| State | Carrier | Crashes in State (by Carrier) |
|---|---|---|
| Alabama | FedEx Express | 79 |
| Alaska | United Freight & Transport | 4 |
| Arizona | FedEx Express | 46 |
| Arkansas | FedEx Express | 50 |
| California | UPS | 185 |
| Colorado | FedEx Express | 46 |
| Connecticut | FedEx Express | 42 |
| Delaware | FedEx Express | 15 |
| District of Columbia | Penske Truck Rental | 17 |
| Florida | FedEx Express | 124 |
| Georgia | FedEx Express | 247 |
| Hawaii | Hawaii Logistic Services | 4 |
| Idaho | Transystems | 14 |
| Illinois | J.B. Hunt | 109 |
| Indiana | FedEx Express | 114 |
| Iowa | FedEx Express | 22 |
| Kansas | FedEx Express | 48 |
| Kentucky | FedEx Express | 90 |
| Louisiana | FedEx Express | 77 |
| Maine | Casella Waste Systems | 25 |
| Maryland | FedEx Express | 69 |
| Massachusetts | Western Express | 25 |
| Michigan | FedEx Express | 120 |
| Minnesota | FedEx Express | 46 |
| Mississippi | J.B. Hunt | 19 |
| Missouri | FedEx Express | 121 |
| Montana | FedEx Express / UPS (tie) | 17 |
| Nebraska | Prime Inc | 17 |
| Nevada | Republic Services | 23 |
| New Hampshire | Irving Energy | 7 |
| New Jersey | FedEx Express | 122 |
| New Mexico | FedEx Express | 20 |
| New York | FedEx Express | 66 |
| North Carolina | GFL Environmental | 71 |
| North Dakota | Hofmann Trucking | 9 |
| Ohio | FedEx Express | 115 |
| Oklahoma | FedEx Express | 66 |
| Oregon | FedEx Express | 40 |
| Pennsylvania | FedEx Express | 213 |
| Rhode Island | WM | 4 |
| South Carolina | FedEx Express | 54 |
| South Dakota | UPS | 6 |
| Tennessee | FedEx Express | 94 |
| Texas | FedEx Express | 227 |
| Utah | FedEx Express | 23 |
| Vermont | FedEx Express | 12 |
| Virginia | FedEx Express | 99 |
| Washington | J.B. Hunt | 21 |
| West Virginia | Western Express | 24 |
| Wisconsin | FedEx Express | 50 |
| Wyoming | FedEx Express | 24 |
Source
- U.S. Department of Transportation, Federal Motor Carrier Safety Administration (FMCSA) — Safety Measurement System (SMS)